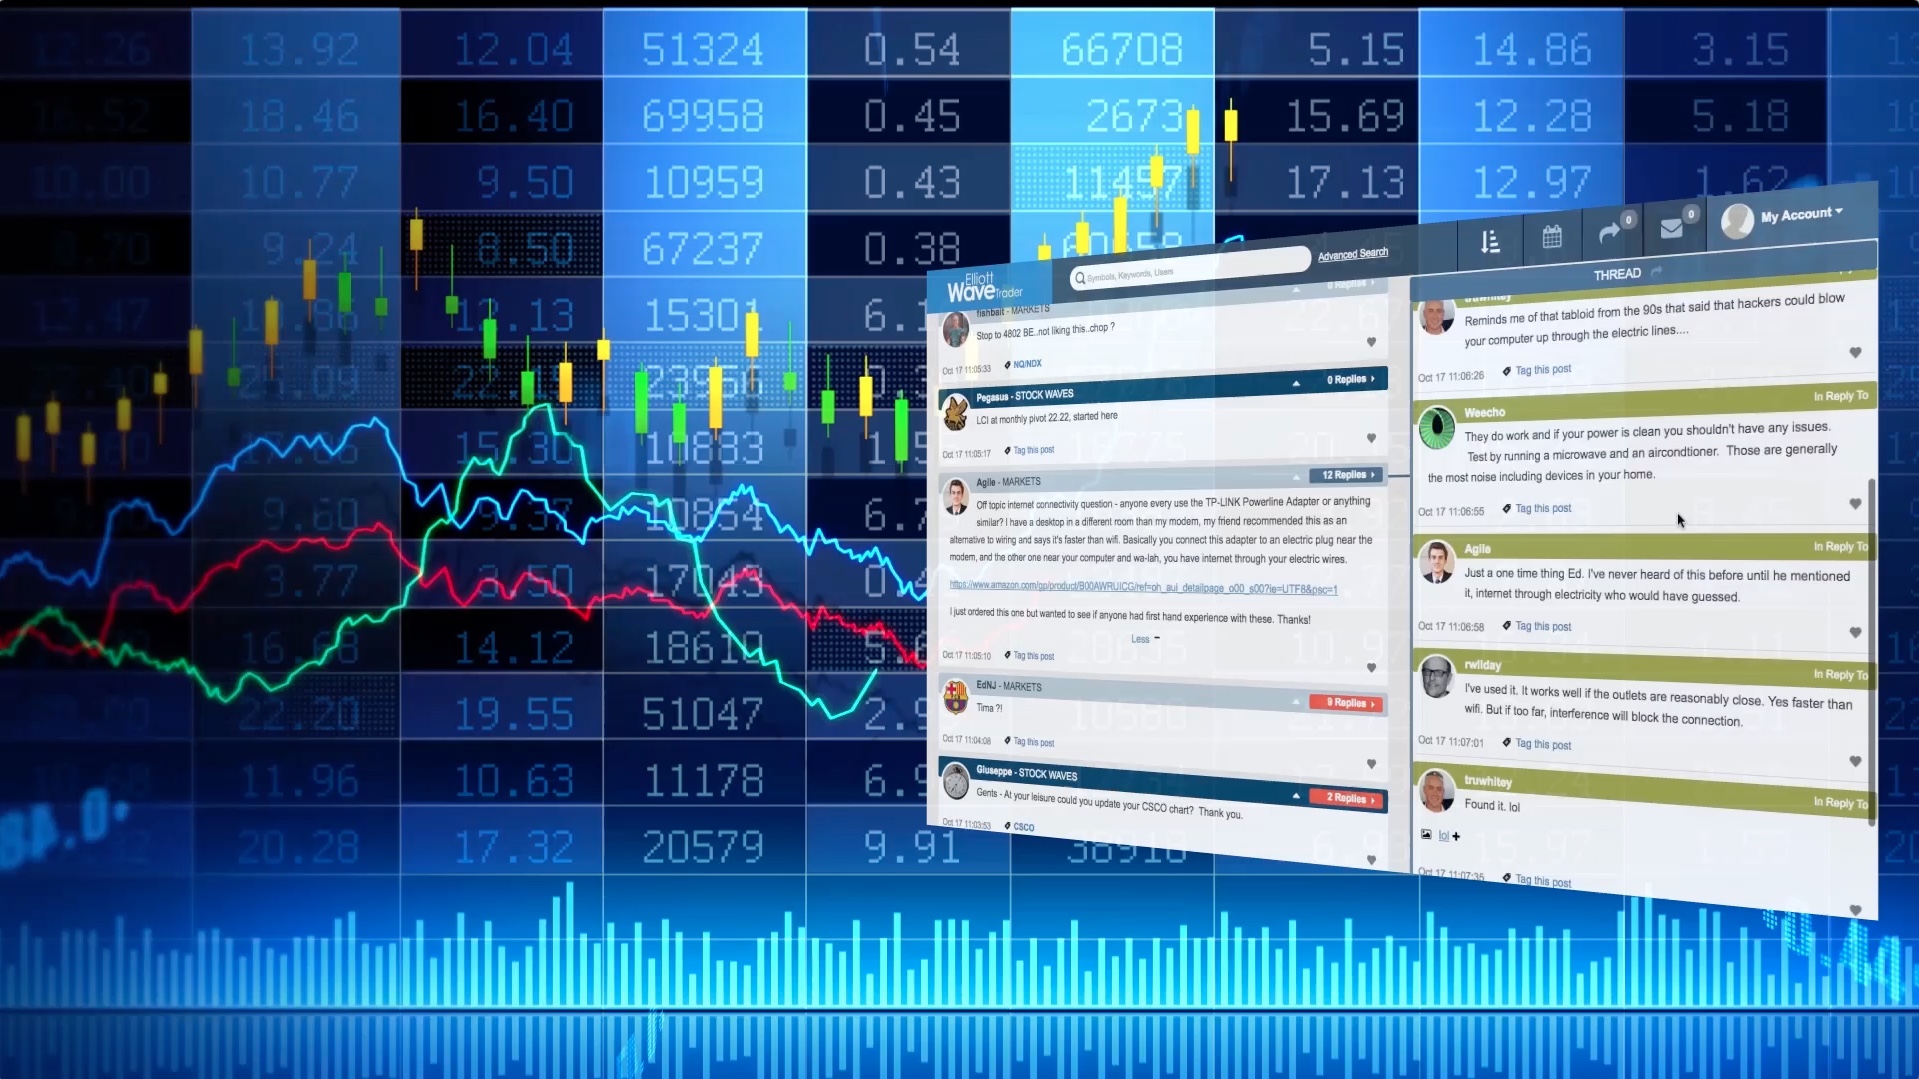
Our Live Trading Rooms Bring Together Thousands of Traders from Around the World!
Good Sunday Afternoon, MPTraders! Last Thursday afternoon, ahead of AAPL's Earnings, this is what we discussed about the stock's probable price path in reaction to the news:Unless AAPL produces something extraordinary, or otherwise announces some unknown bullish catalyst, my pattern work has a very difficult time expecting anything other than a "best-case" sell-the-news scenario in reaction to Earnings. I can make a compelling argument that the upleg from the 6/26/26 low at 273.33 to the 7/29/26 ATH at 344.
Desk Note: ES + NQ into End of SummerWe’ll leave with this: this week’s current low on ES+NQ will be very critical moving forward as we wrap up the rest of summer.
In Case You Missed It…As expected, it was not a boring week for equities or volatility. Excluding the broad-based short squeeze seen on Thursday, the equity indexes remain out of sync with each other. I have never seen this condition last this long. It portends more choppy, sideways, price action and the word I have been repeating for months now: indecision. To that end, we are still trading around the Gamma Threshold level and have yet to establish a true long- or short-gamma regime.
Our Technical Analysts Share Their Expertise 24/7 on a Vast Range of Markets!